|
| ||
|
| ||
 |
When you manage SEO campaigns for many sites, you are looking for anomalies in the form of rising or falling metrics since only they make it clear whether you have chosen the right strategy and whether you are executing it correctly. Usually, you have to spend a huge amount of time navigating through Google Search Console and Google Analytics 4 for each property to look for such anomalies in the data. This is especially depressing because none of these tools allow to:
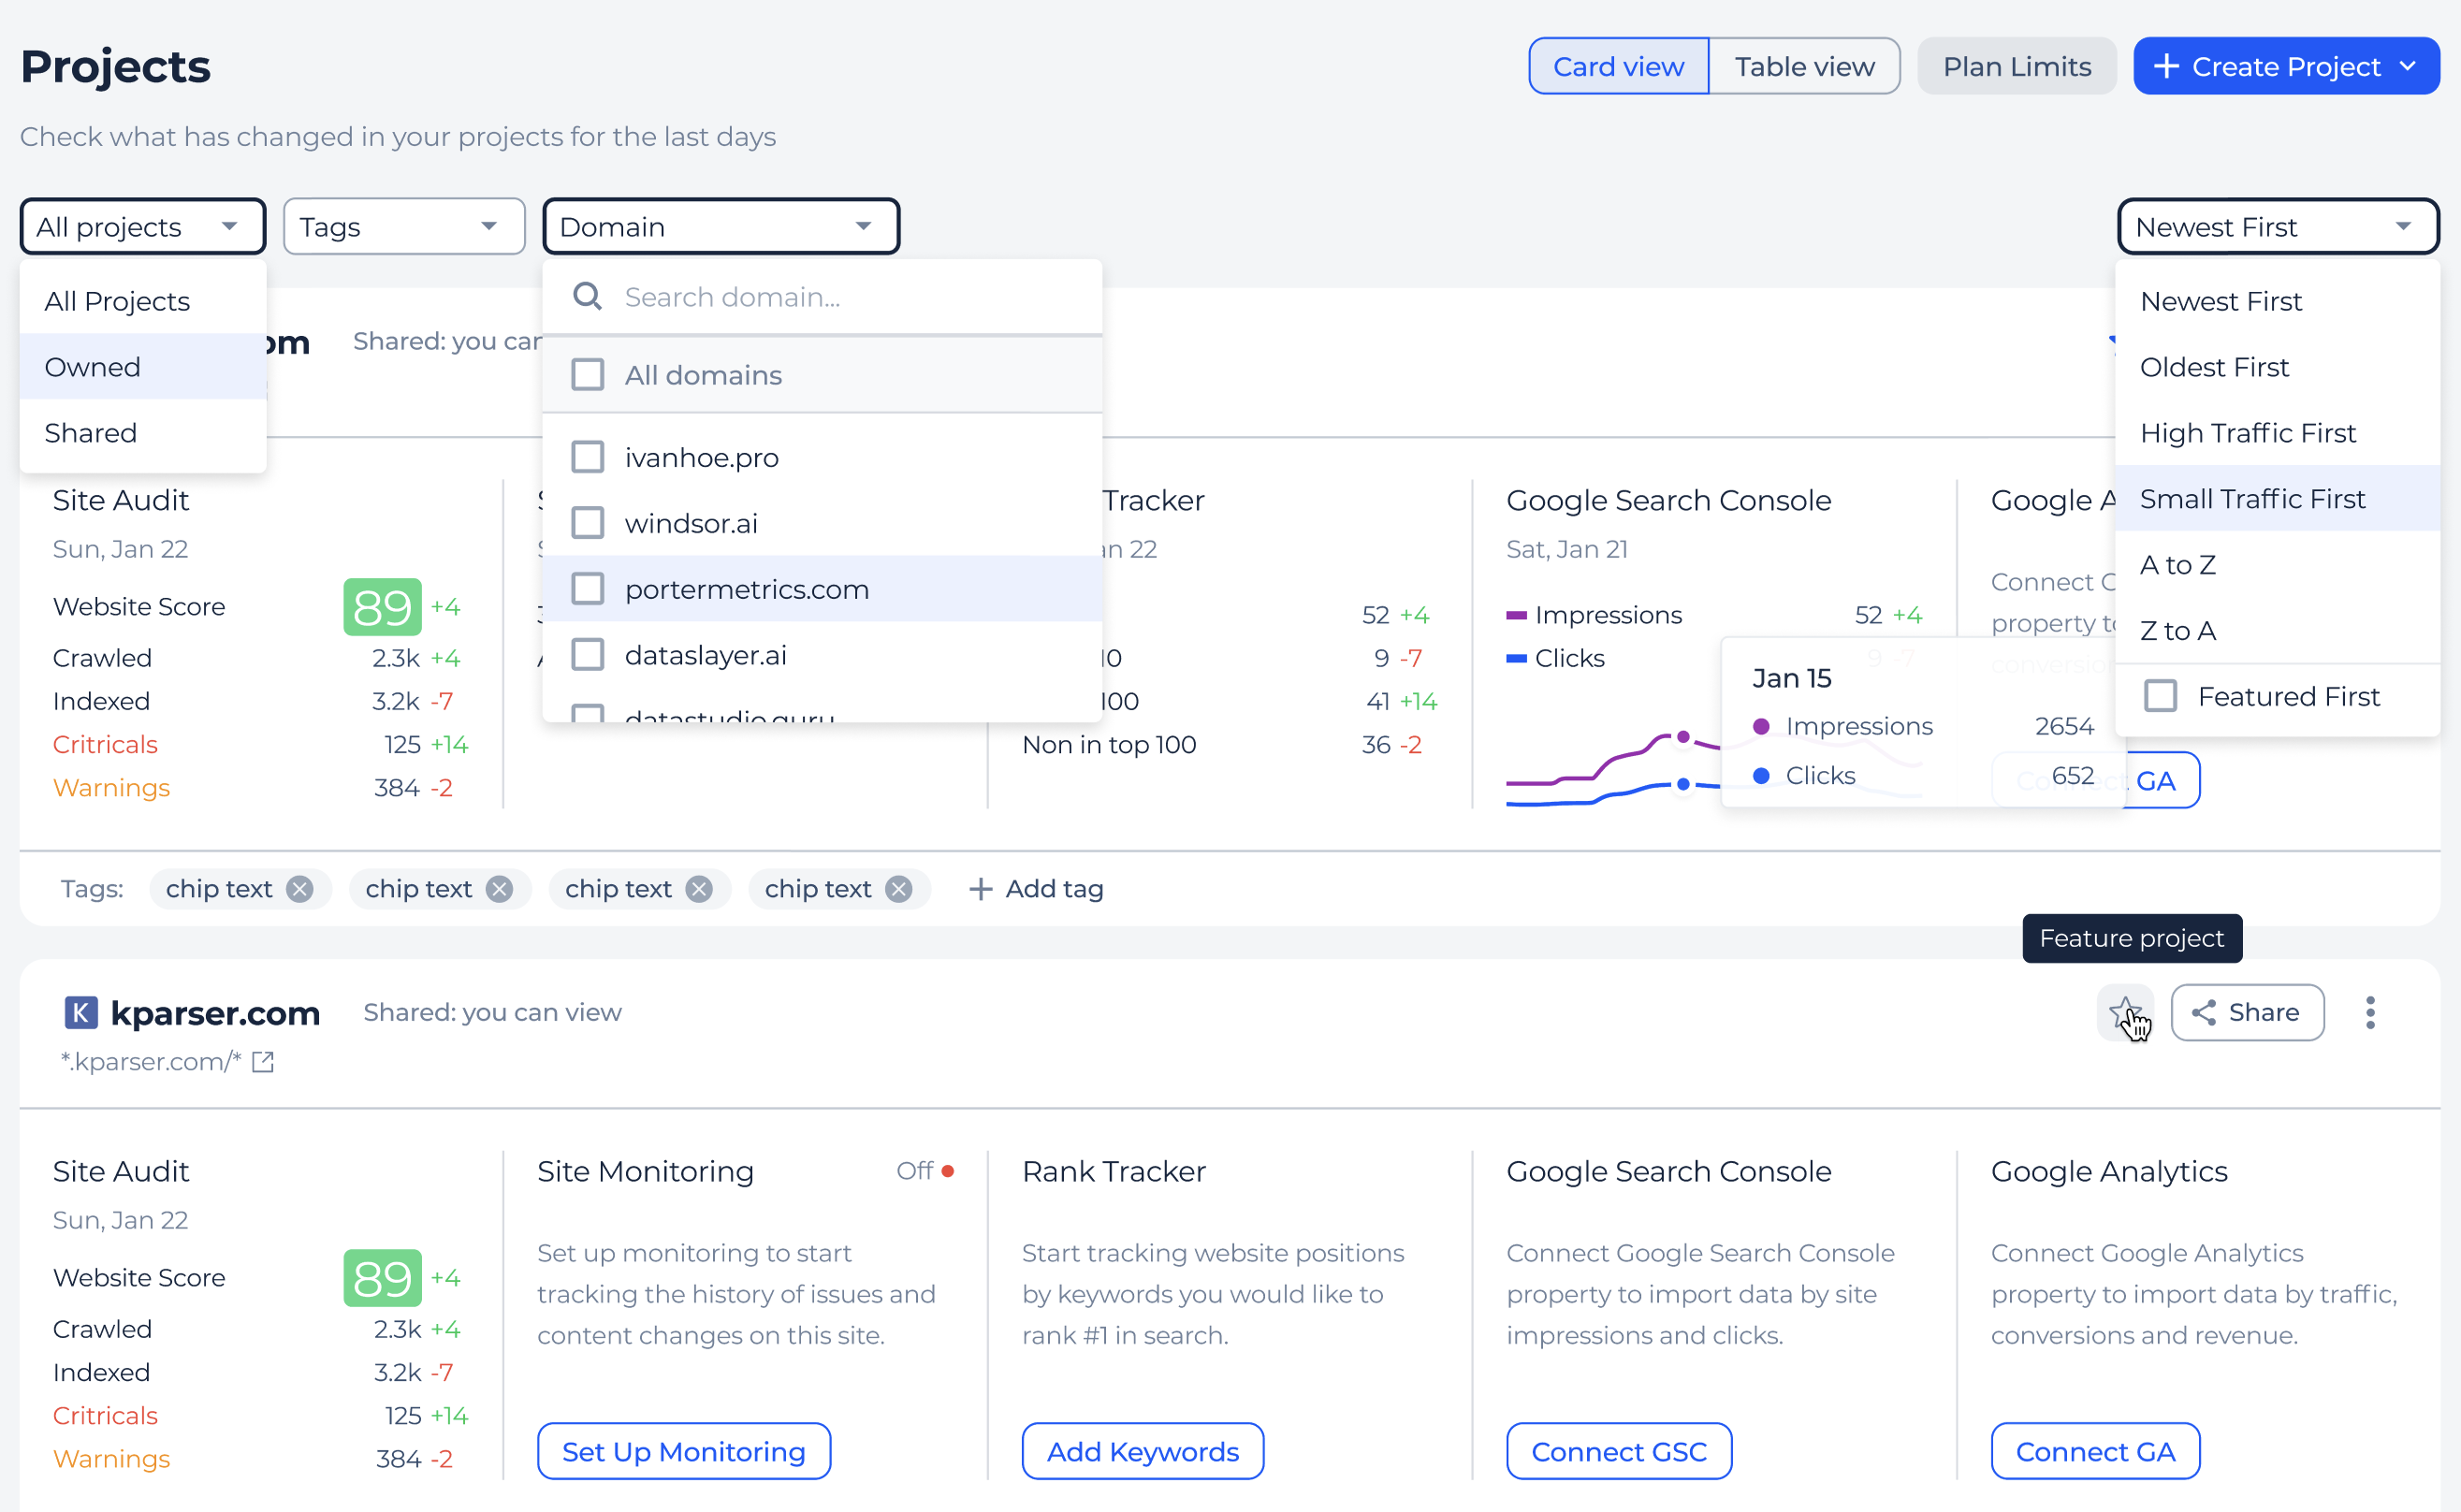
This is one of the key pain points that Sitechecker was created to solve. The more websites you manage, the more time you save using the two options below. Projects ListThis is the app home page, you see it every time you log in to the Sitechecker. To use this page to its fullest:
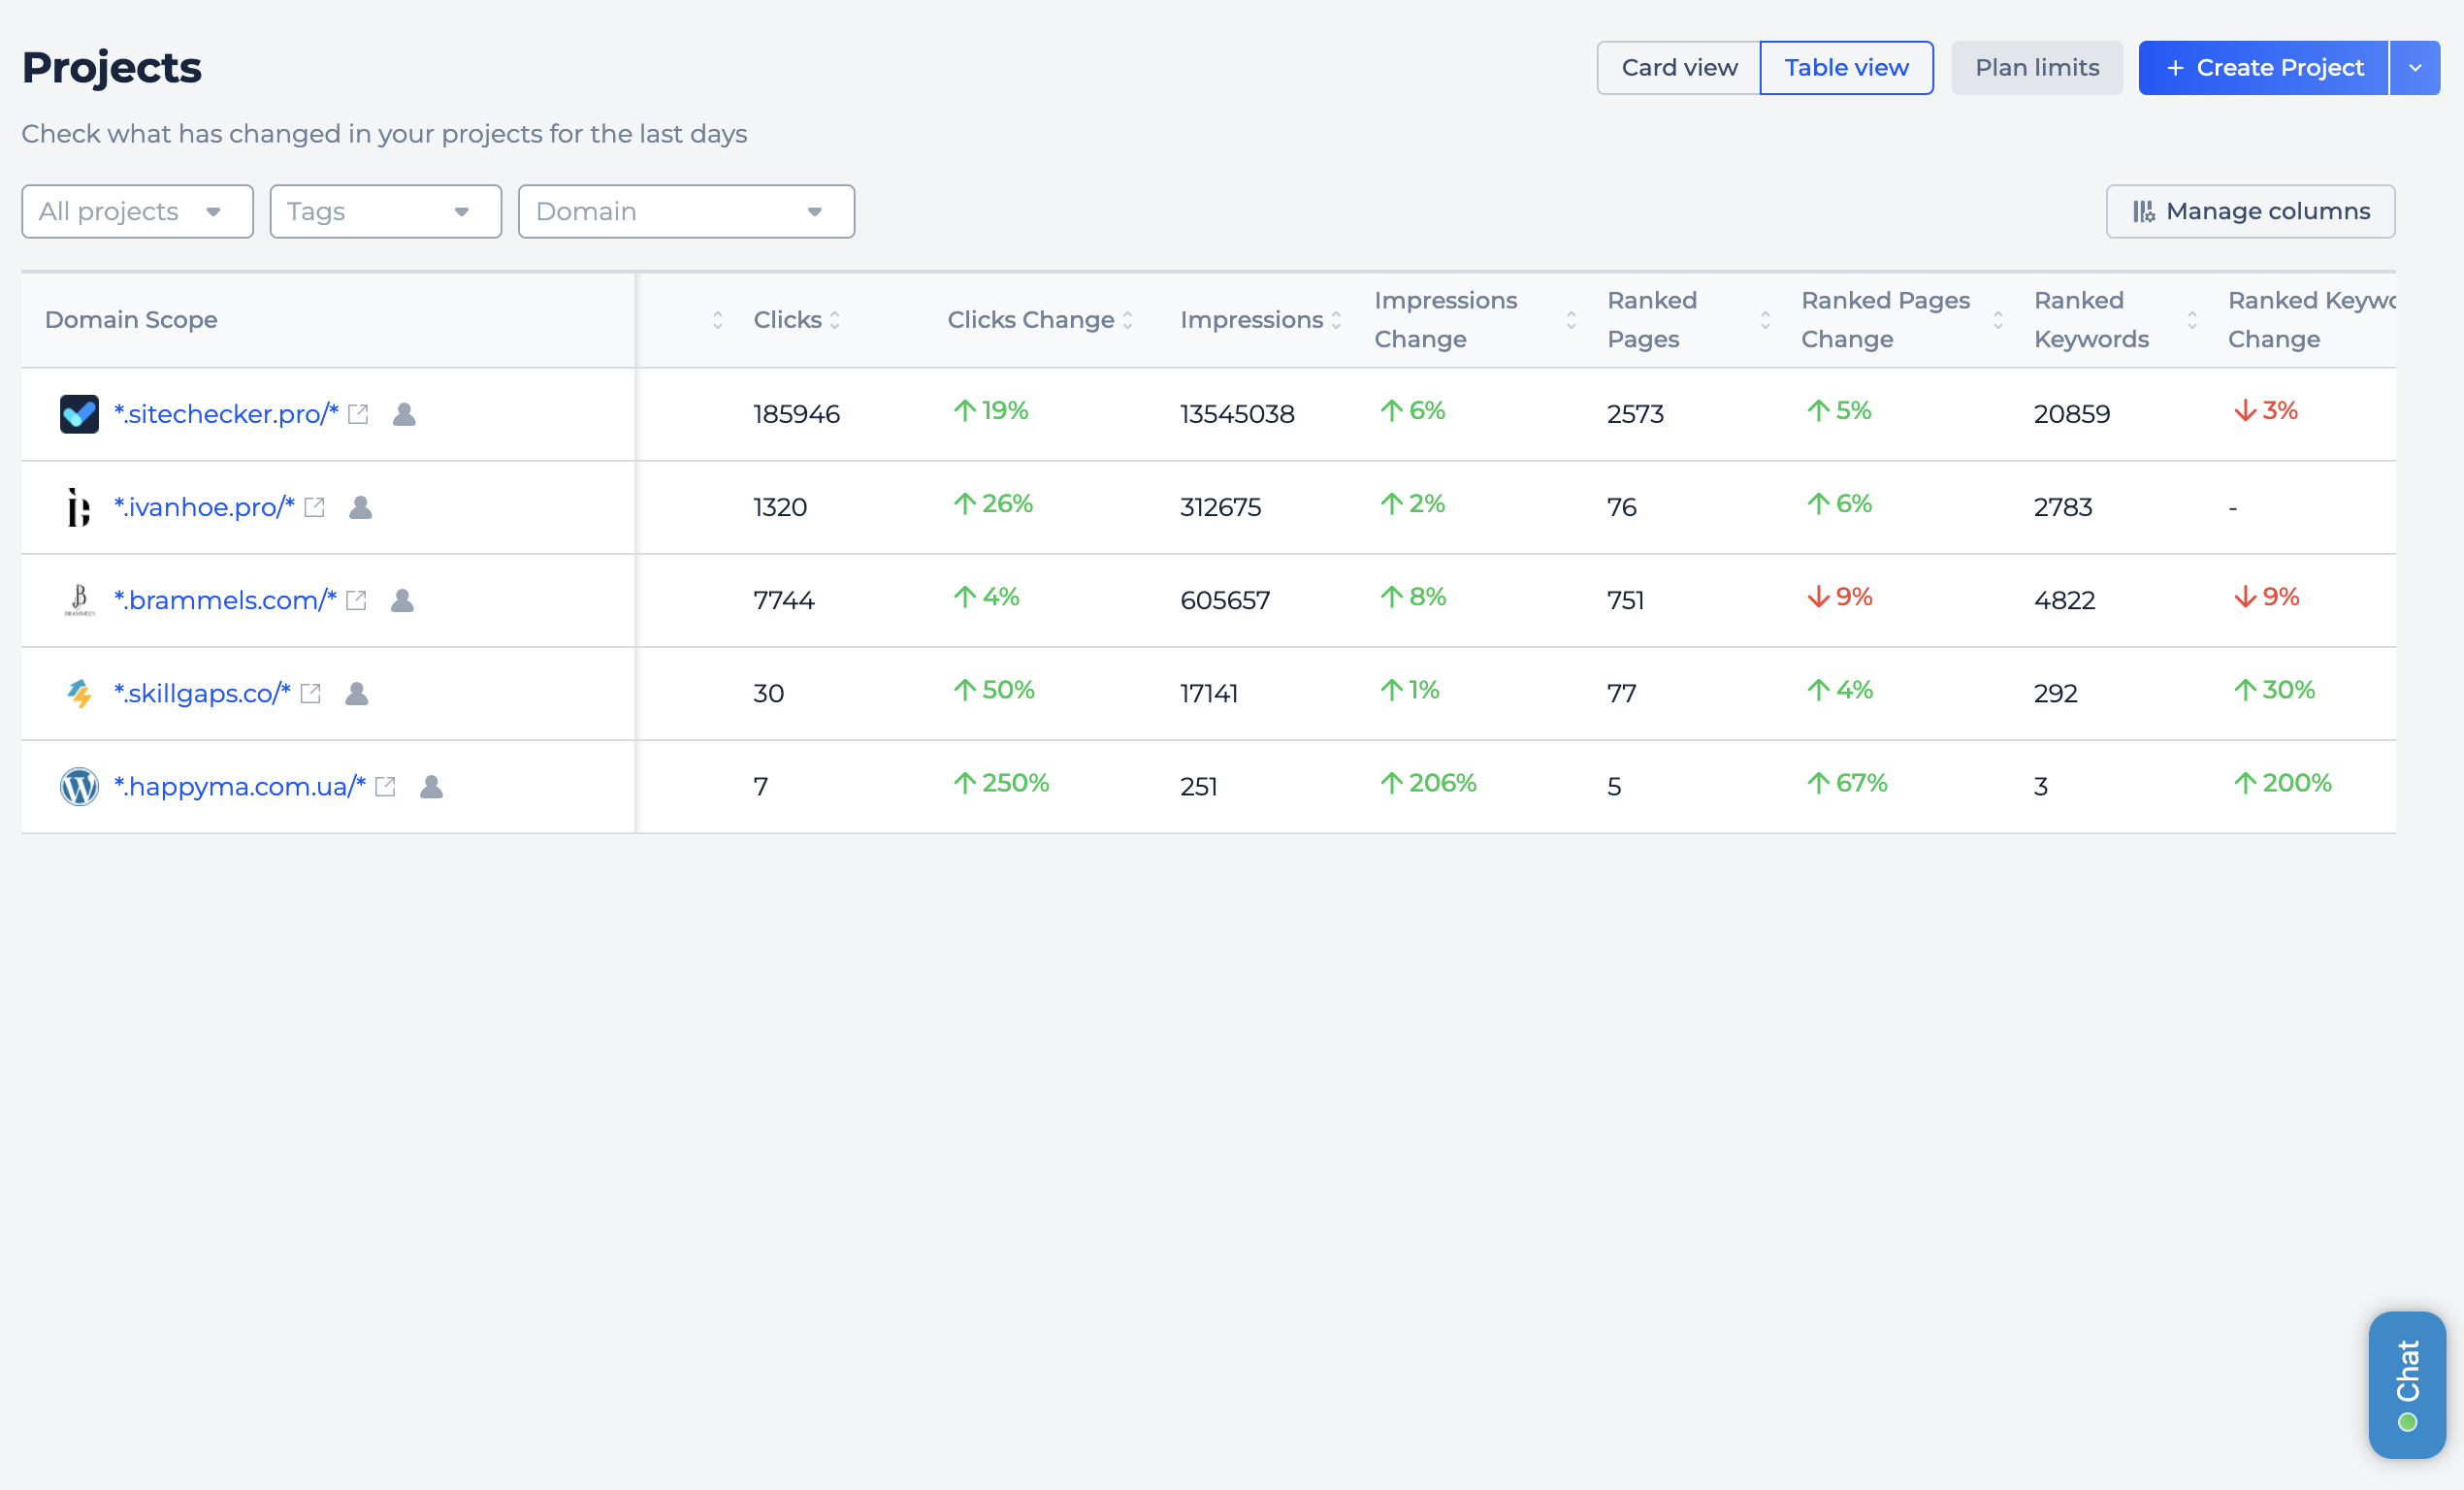
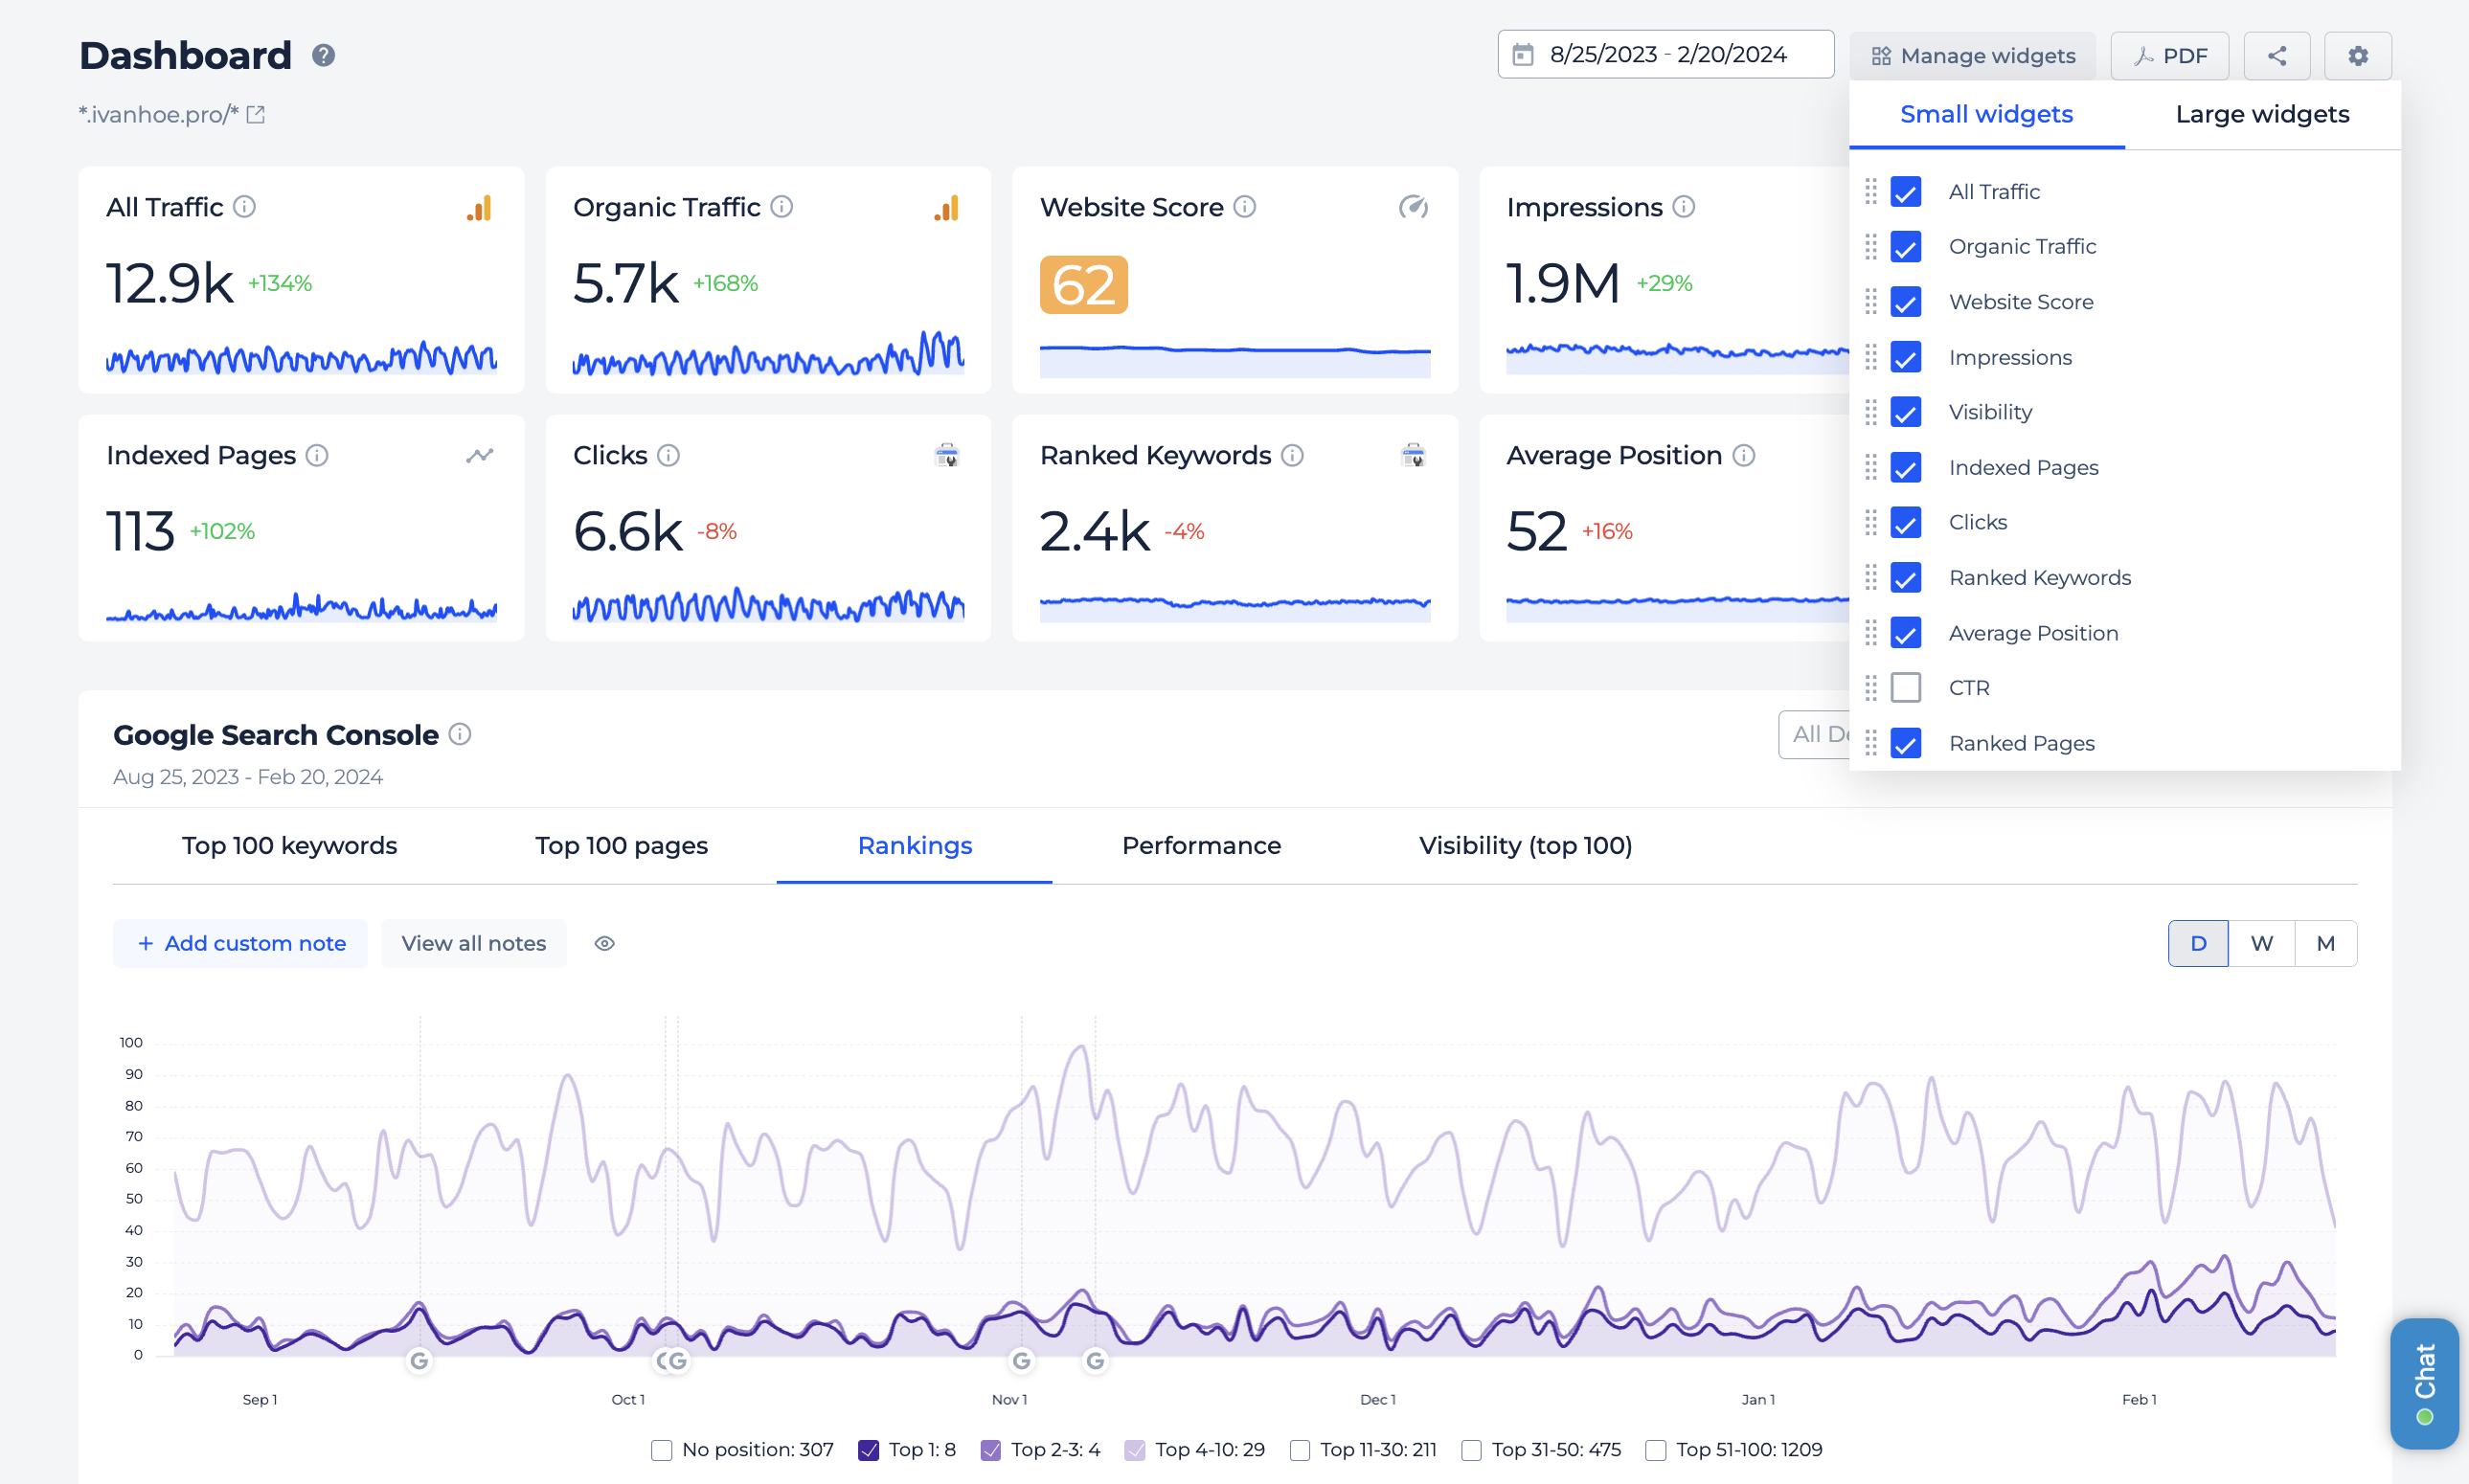
 Note, that you also can switch to the Table view and sort all your projects by changes in important SEO metrics like Impressions, Clicks, Ranked Pages, etc..  Project DashboardThis is the main page for each project that contains the most important information excerpts from all tools and integrations. To use this page to its fullest:
The changes you’ll make in the two steps above will be applied to all Project Dashboards.  And don’t forget to add custom notes to the charts when you make any important changes on the website to measure the impact of both your work and Google updates on SEO metrics. Do you need any help in customizing Projects List or Dashboard? Request a demoWe will do it for you in real time. |
This notification is sent to you as a part of your Sitechecker account. Unsubscribe or sign in to account © 2024 Sitechecker. All rights reserved |